

Description
Real-Time Command Line Monitoring
Top offers a lightweight solution for real‑time monitoring directly from the command line in Laravel applications. It is intended for production environments, allowing you to easily track essential metrics and pinpoint the busiest routes.
Top listens to Laravel events and aggregates data in Redis behind the scenes to compute metrics. The aggregated data has a short TTL so that historical information is not retained, preventing Redis from becoming overloaded. When displayed, metrics are calculated based on the average of the last five seconds of data.
Only incoming request events are monitored; metrics from queue operations or Artisan commands are not captured.
Because the data resides in Redis, running the top command reflects information from all application servers, not just the local one.
Creator
Levent Corapsiz
Related Projects
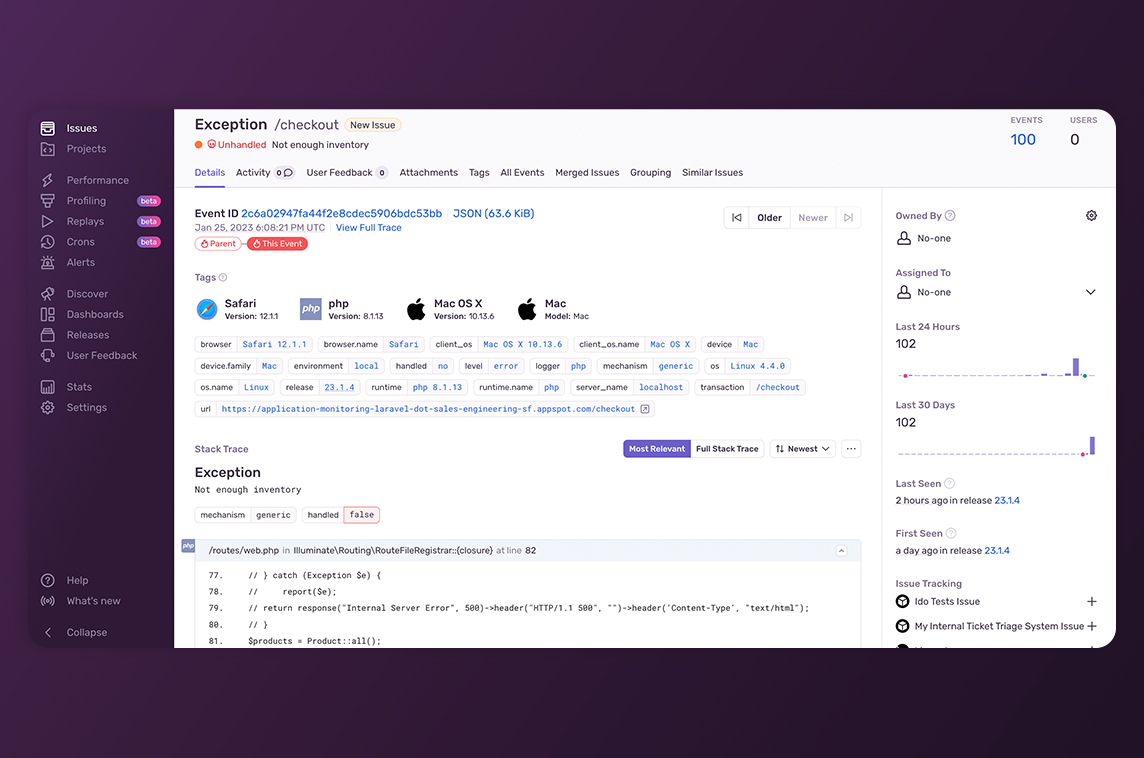
Sentry for Laravel
Laravel Error & Performance Monitoring
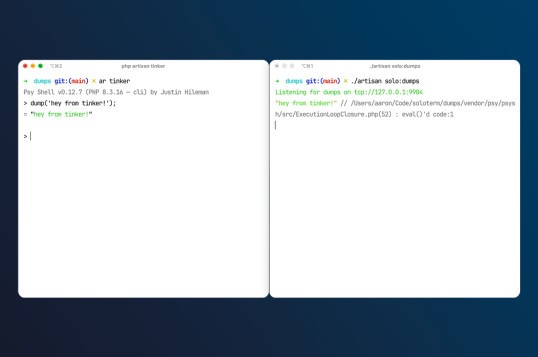
Solo Dumps for Laravel
Intercept & Collect Dumps
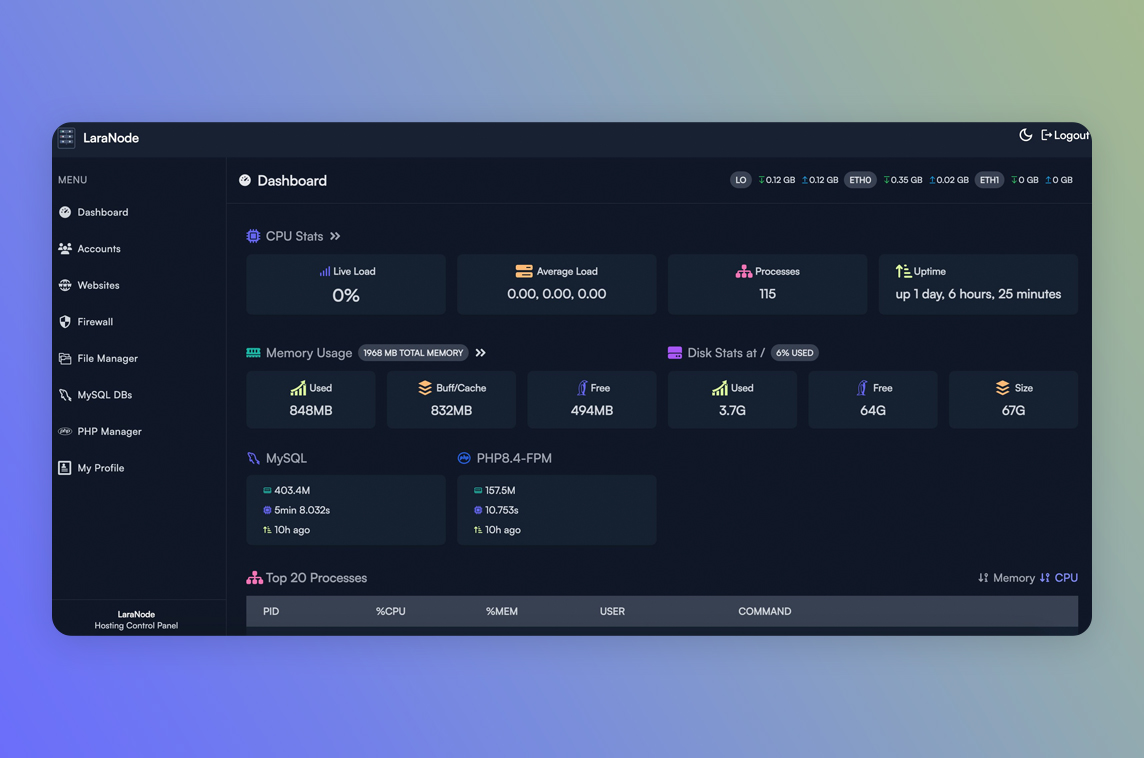
Laranode
Open-Source Alternative to cPanel/Plesk
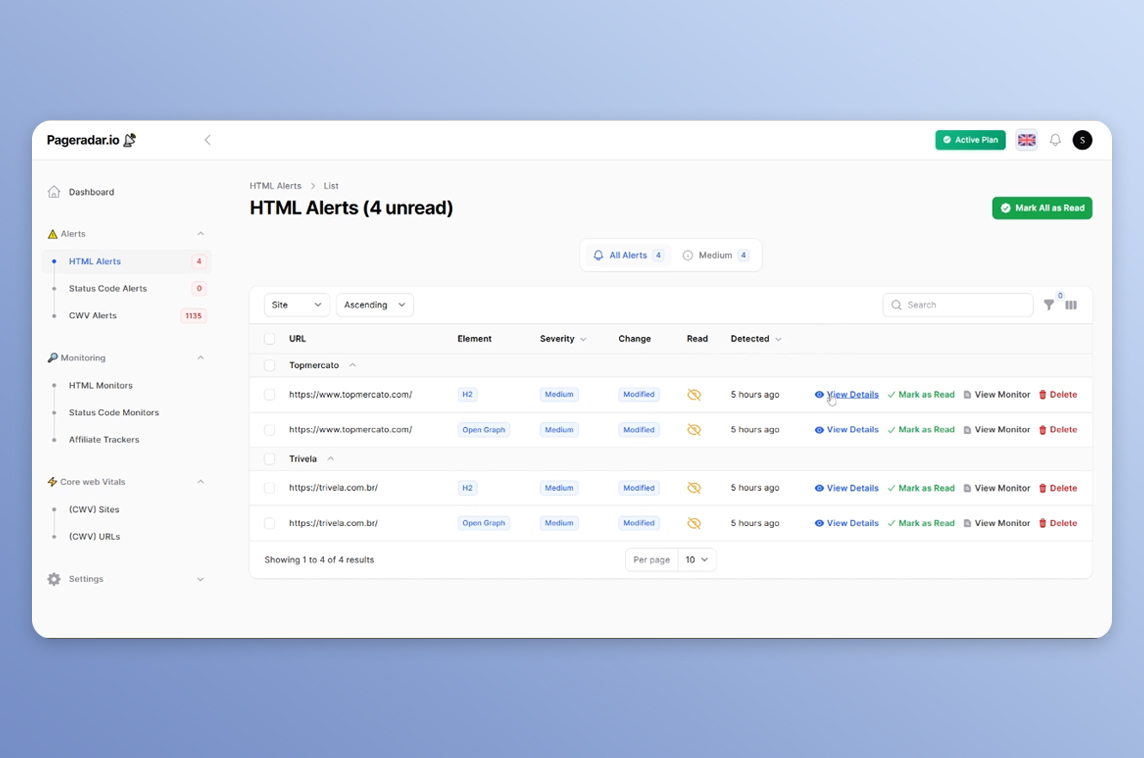
Pageradar
Website Monitoring Tool
exchangerateapi.net
Exchange Rate Data API

Laravel Spy
Track & Log Outgoing HTTP Requests