
AG Charts for React
Canvas-based Charting Library


Description
Canvas-based Charting Library
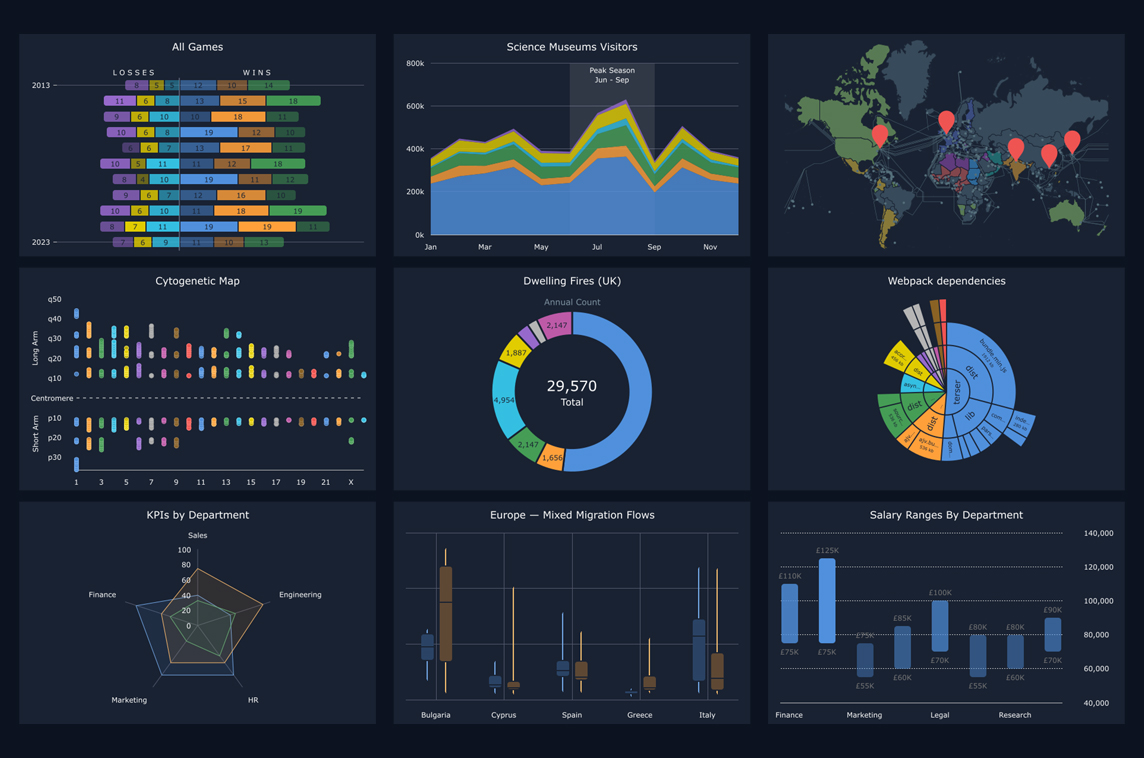
AG Charts is a comprehensive JavaScript charting library that offers extensive customization options, making it the preferred choice for developers creating enterprise-level applications.
The library supports 23 distinct chart types, ranging from basic line, pie, and bubble charts to more sophisticated visualizations such as heatmaps, sunburst charts, and box plots.
Key advantages include exceptional performance, zero reliance on third‑party dependencies, and seamless integration with React applications.
Creator
AG Grid
@ag_grid
Related Projects
Hightable
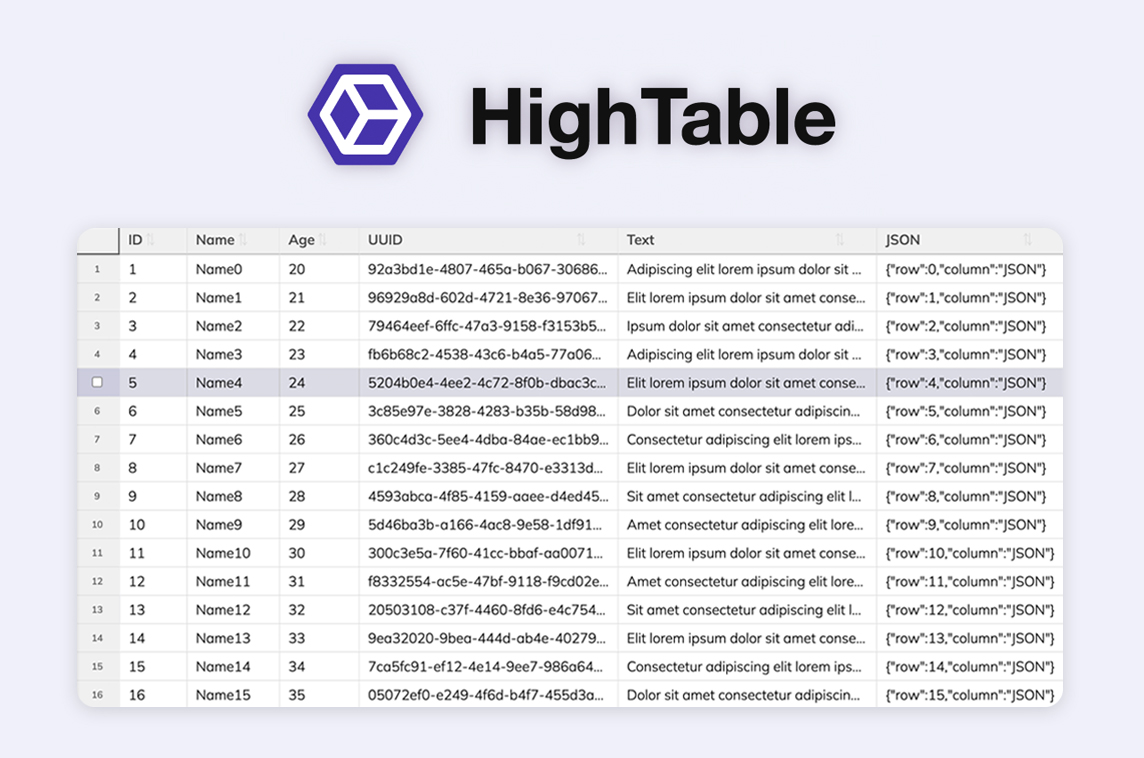
Virtualized Table Component
Dice UI
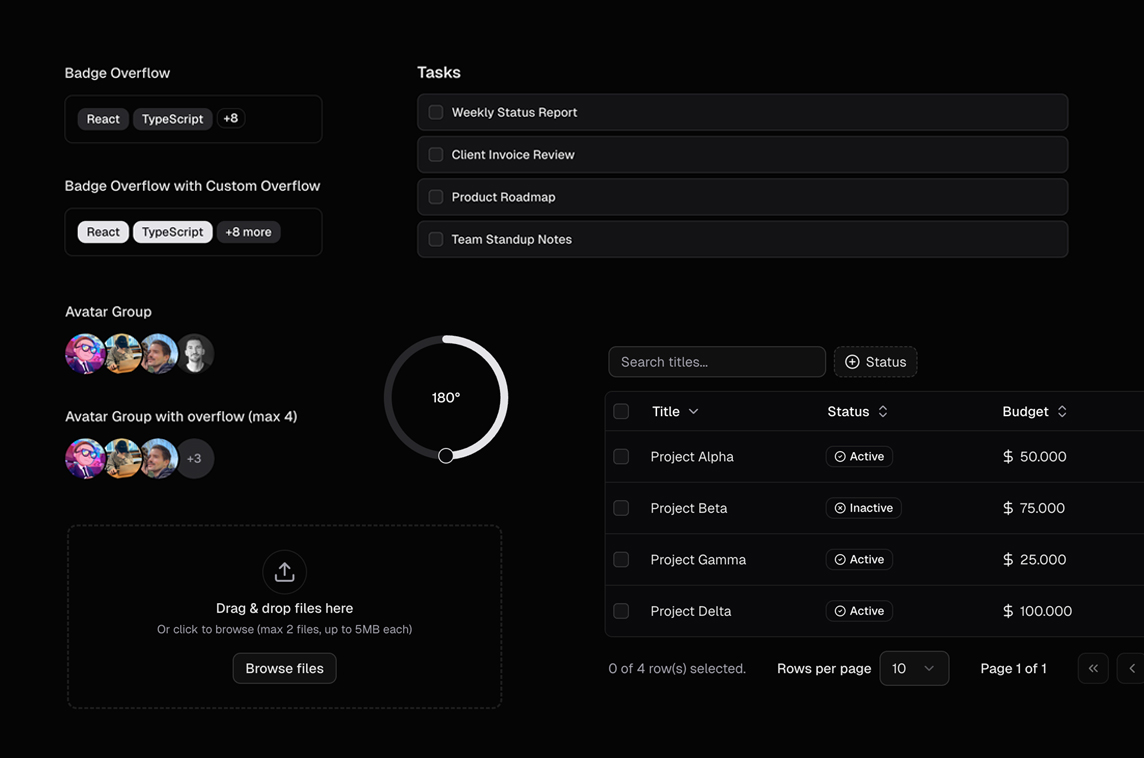
Shadcn/ui Component Library
FileKit.dev for React
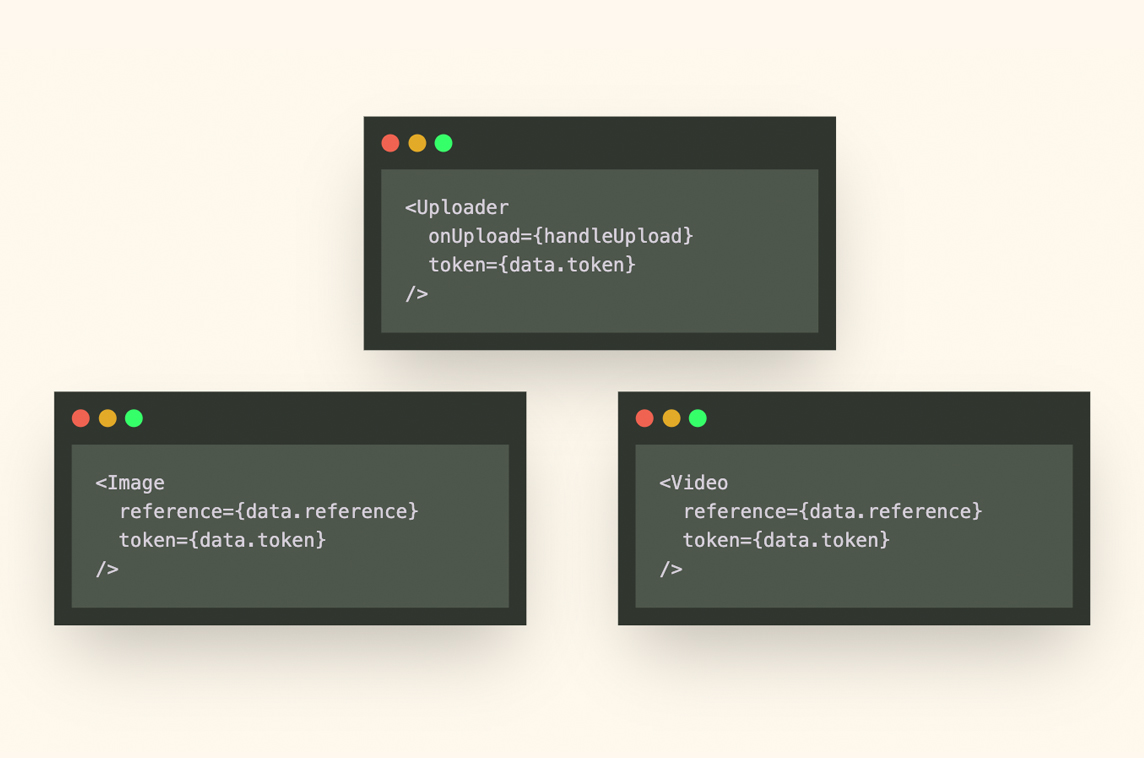
Drop-in File Upload & Media Streaming Components
Sillybits
Landing Page Building Blocks
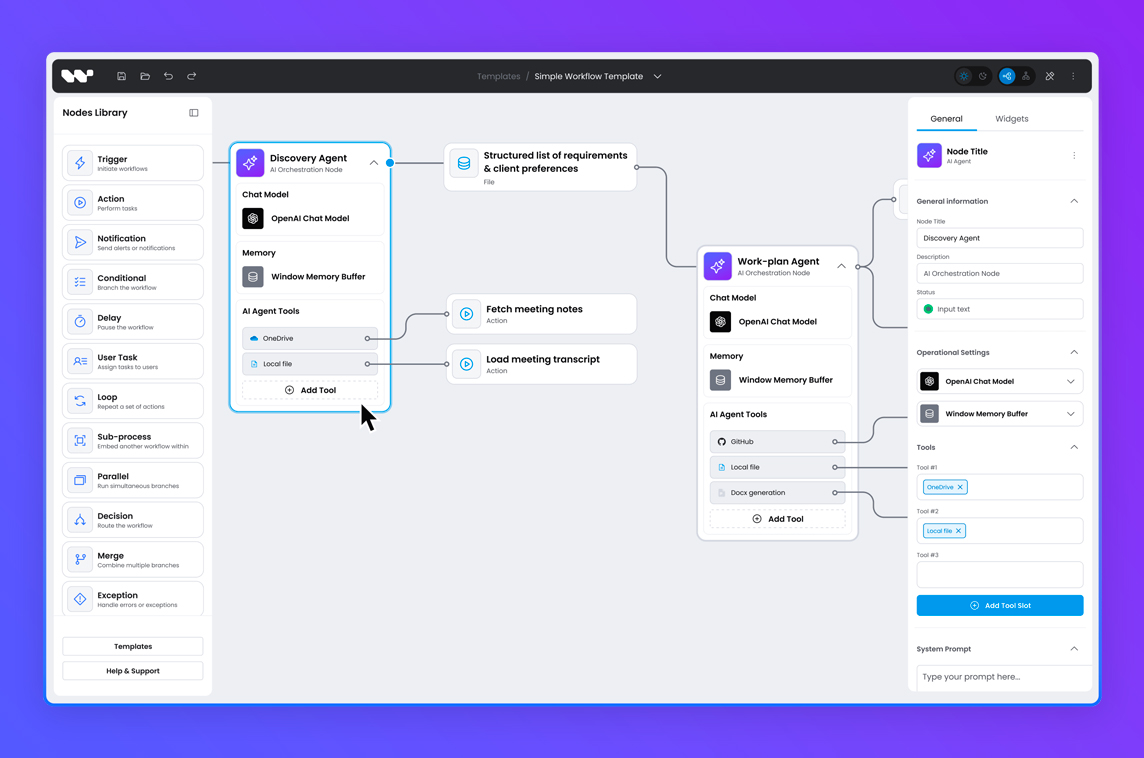
Workflow Builder
Node-based Workflow Editor SDK
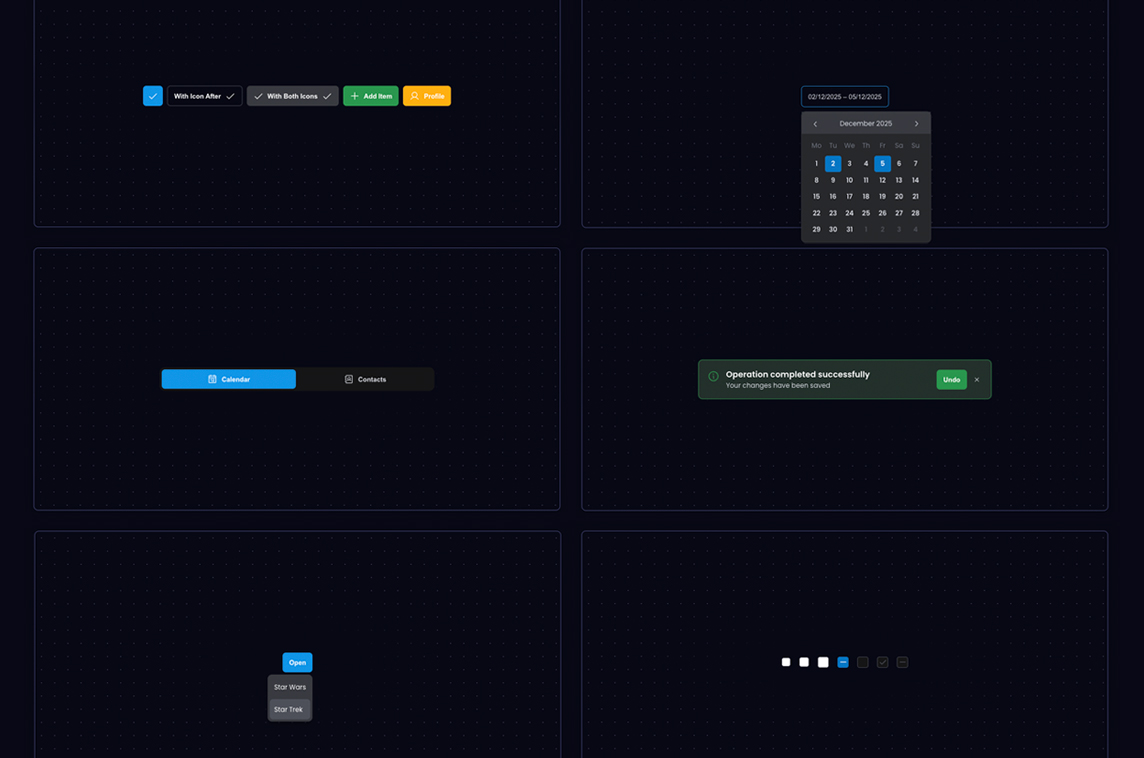
Overflow
Open-source UI Components for React Flow