
AG Charts for Vue
Canvas-based Charting Library


Description
Canvas‑Based Charting Library
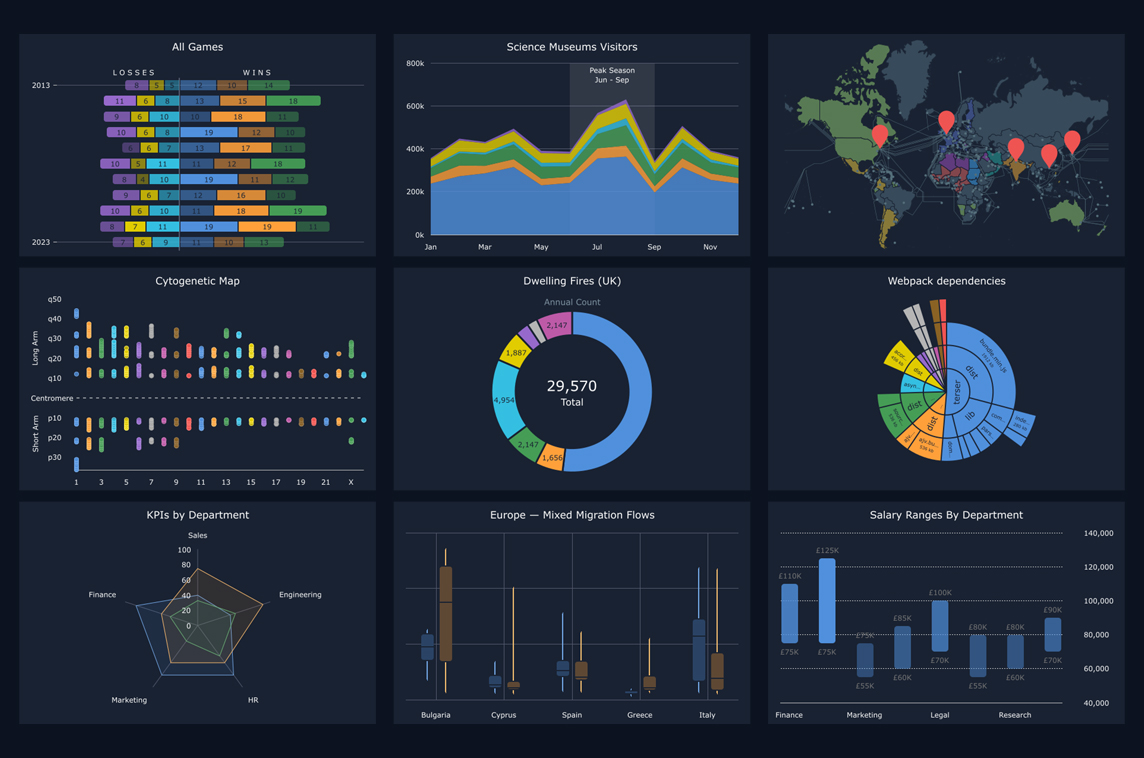
AG Charts is a comprehensive, highly customizable JavaScript charting library that serves as the preferred choice for developers creating enterprise applications. It supports 25 distinct chart types—including line, pie, bubble, heatmaps, sunburst charts, and box plots—offering both basic and advanced visualization options.
The library delivers exceptional performance, operates without third‑party dependencies, and integrates seamlessly with Vue 3 applications.
Creator
AG Grid
@ag_grid
@ag-grid.bsky.social
Related Projects
Markstream
AI-powered Streaming Markdown Renderer
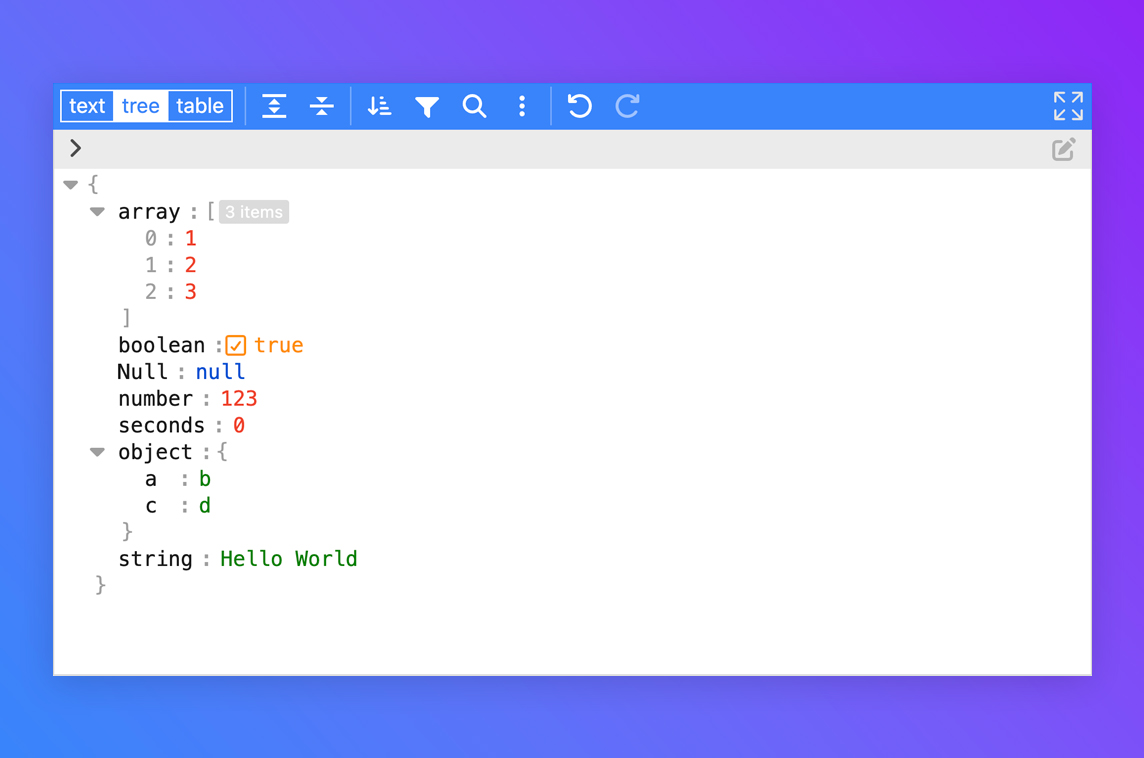
Vue 3 JSON Editor
JSON Editor Component
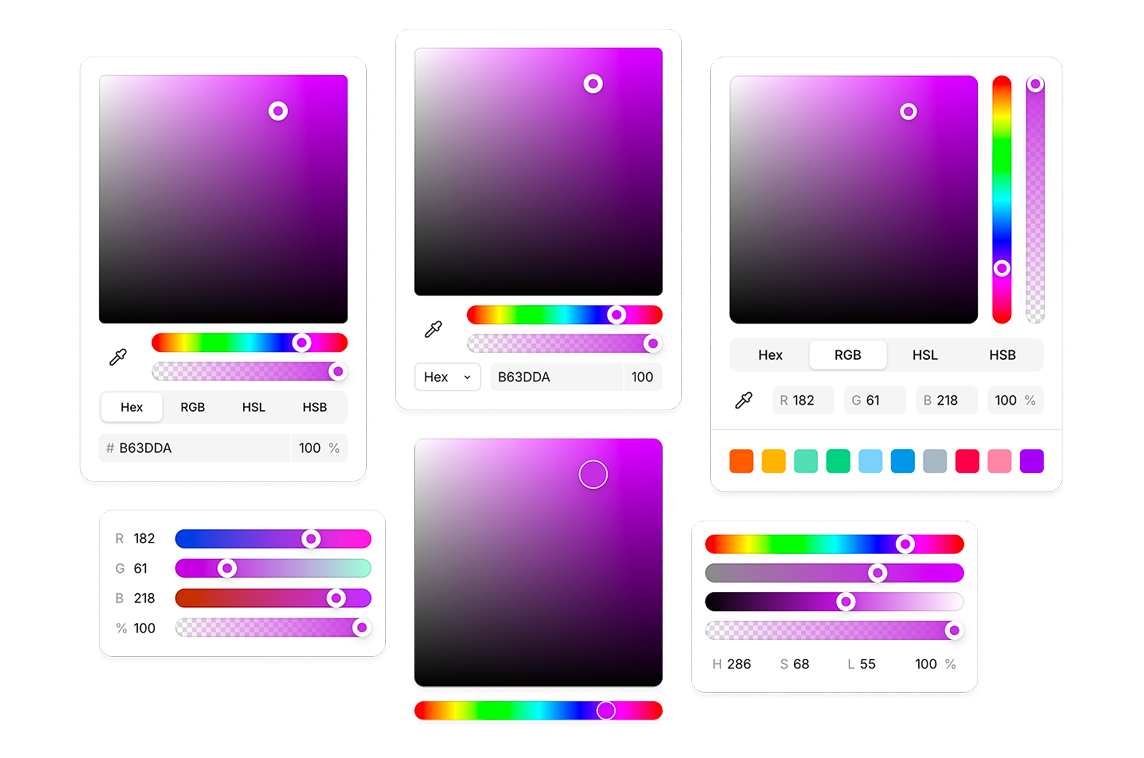
Vuelor
Colorpicker Component
Roughness
Hand-drawn Component Library

Stk Table Vue
Virtual List Component

Phosphor Icons Vue
Icon Set