
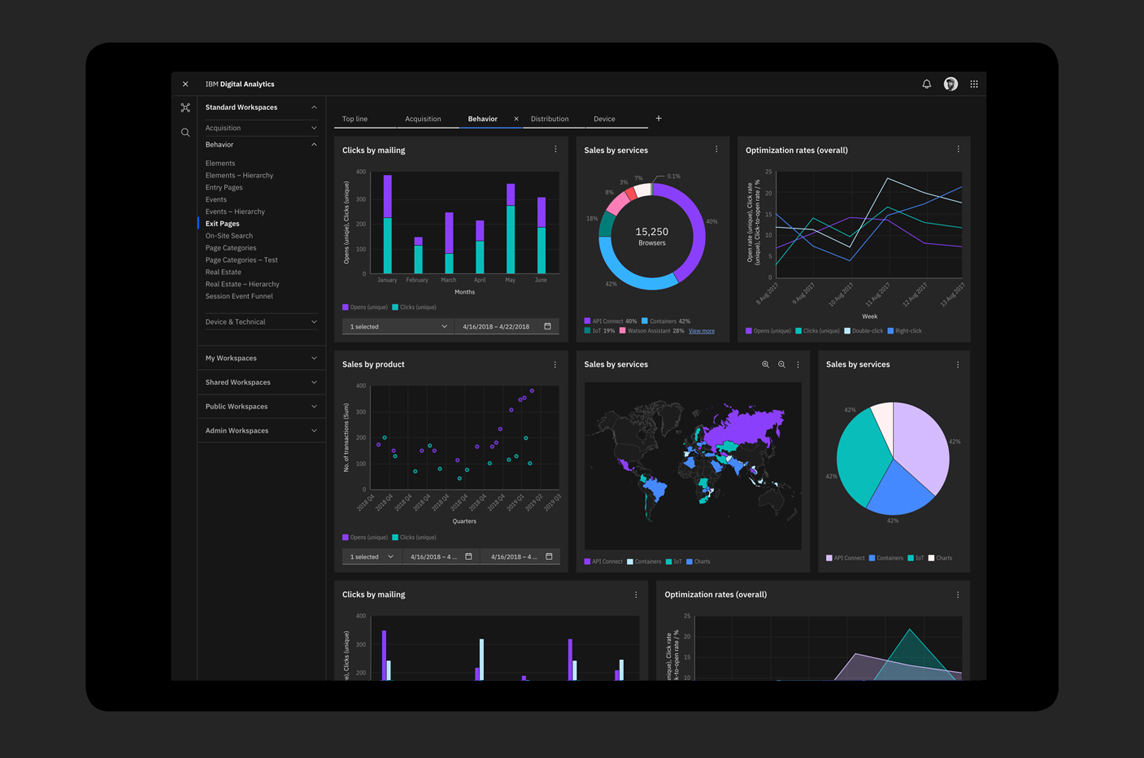
Carbon Charts Vue
D3 Charting Library


Description
D3 Charting Library
Carbon Charts is a robust data‑visualisation framework built with D3 and TypeScript.
The reusable library includes a variety of chart components such as bar, line, pie, tree, heatmap, word cloud, and more.
It also provides a Vue.js wrapper for seamless integration.
Related Projects
Markstream
AI-powered Streaming Markdown Renderer
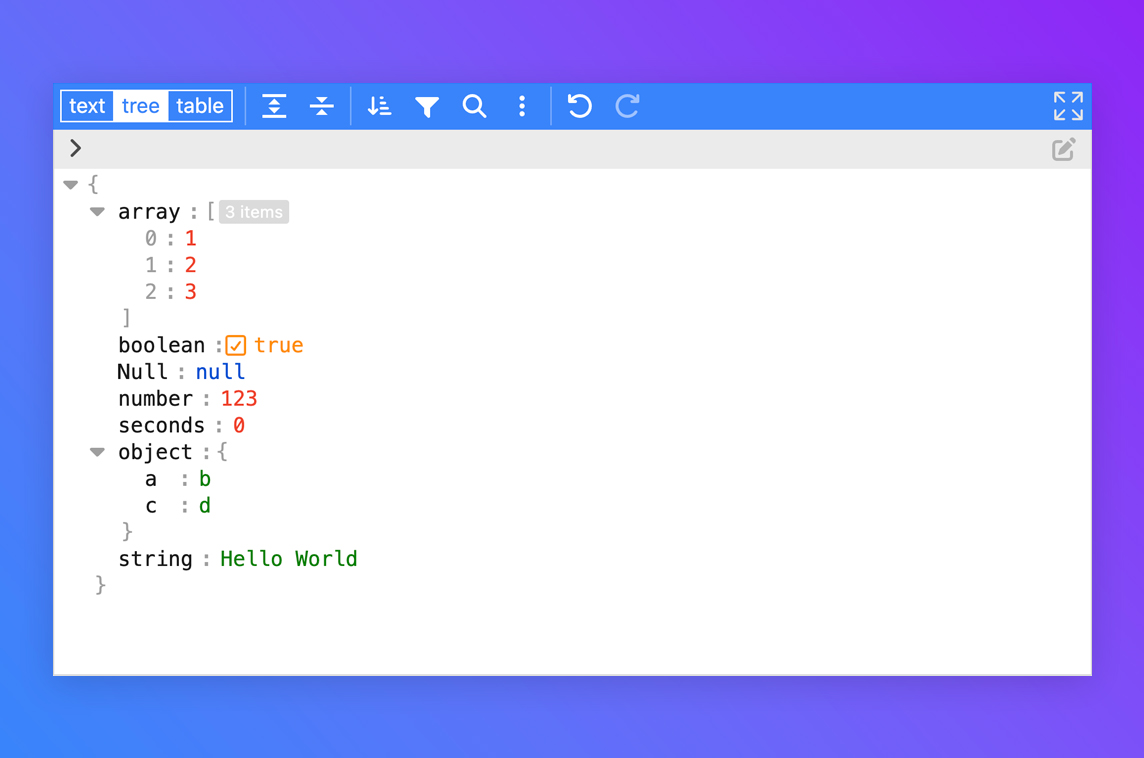
Vue 3 JSON Editor
JSON Editor Component
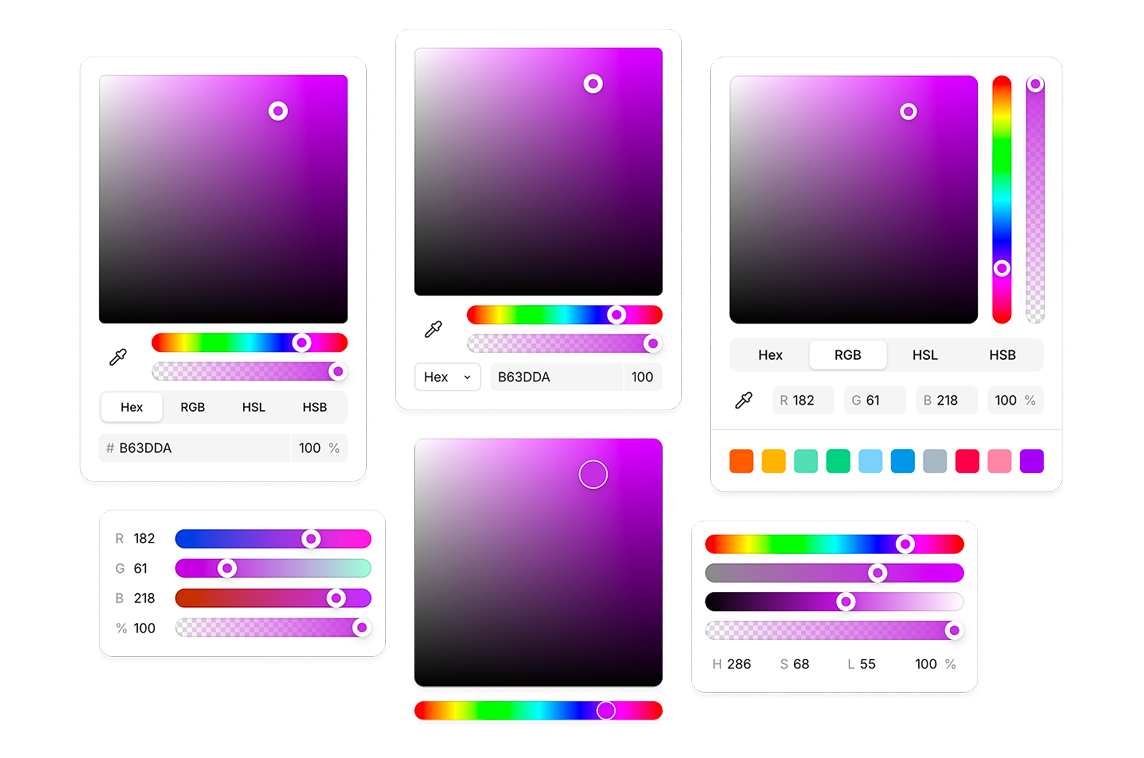
Vuelor
Colorpicker Component
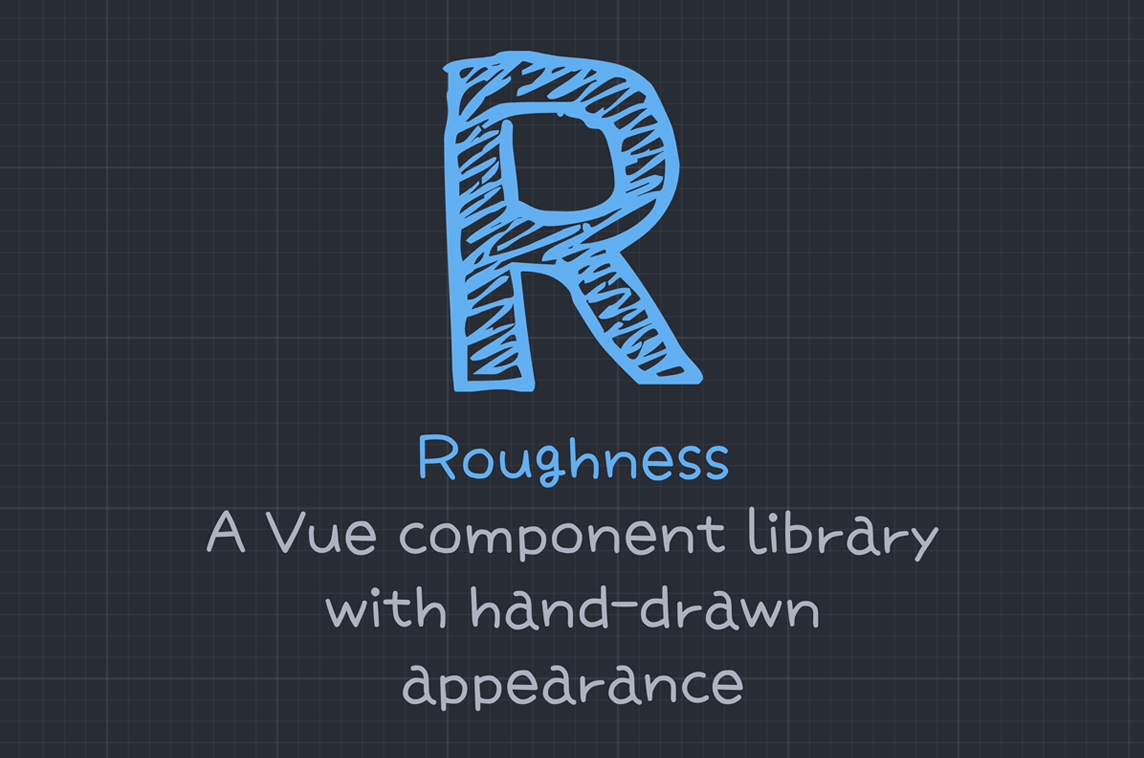
Roughness
Hand-drawn Component Library
Stk Table Vue
Virtual List Component

Phosphor Icons Vue
Icon Set