
Nightlight During Conflict
Data Viz showing how Conflict impacts Countries

Description
Data Visualization of Conflict Impact on Nations
Overview
Grasping how a conflict affects a country is complex. This dashboard employs night‑light data—measurements of nighttime light emissions—to illustrate the effect. Numerous studies have identified a strong correlation between night‑light intensity and GDP.
Feature: Nightlight During Conflict
The tool displays longitudinal night‑light data for Syria and Yemen, offering up‑to‑date insights into how ongoing conflicts influence these countries.
Technical Stack
- Frontend Framework: Vue.js with Vuetify components
- 3D Mapping Library: DECK.GL
- Line Plotting Library: D3.js
Creator
PNGK
@PNGKtech
Related Projects
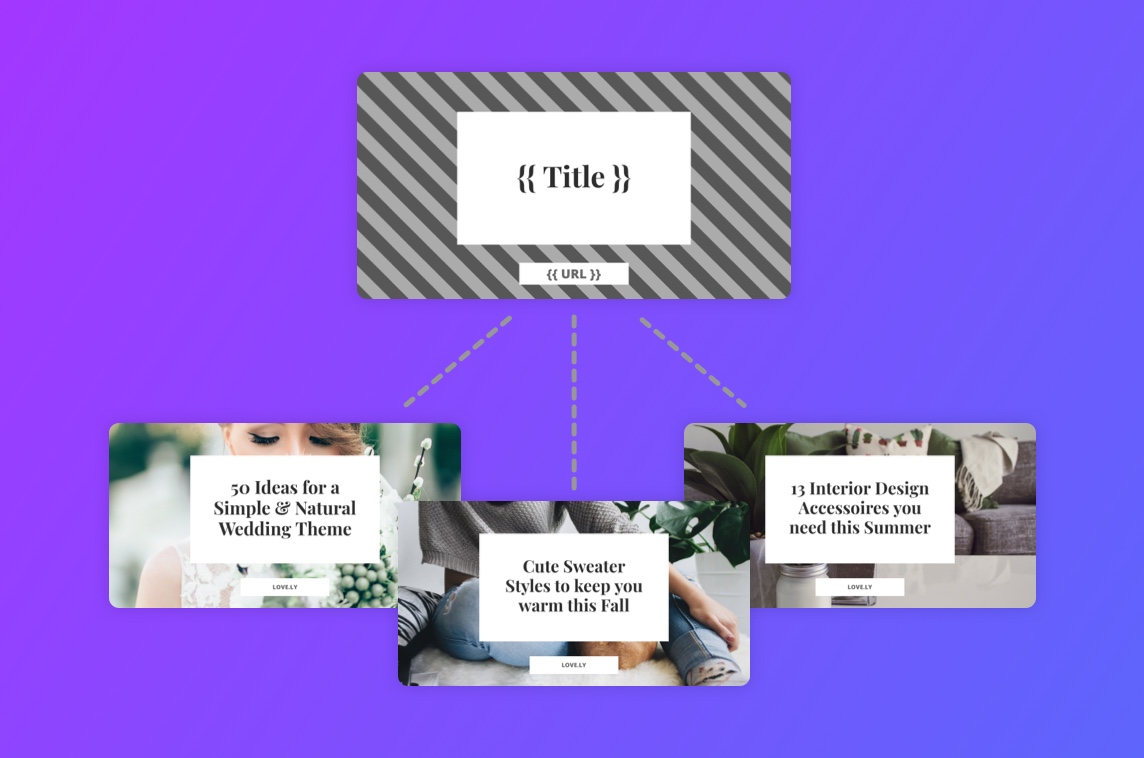
Placid.app
Creative Automation Toolkit
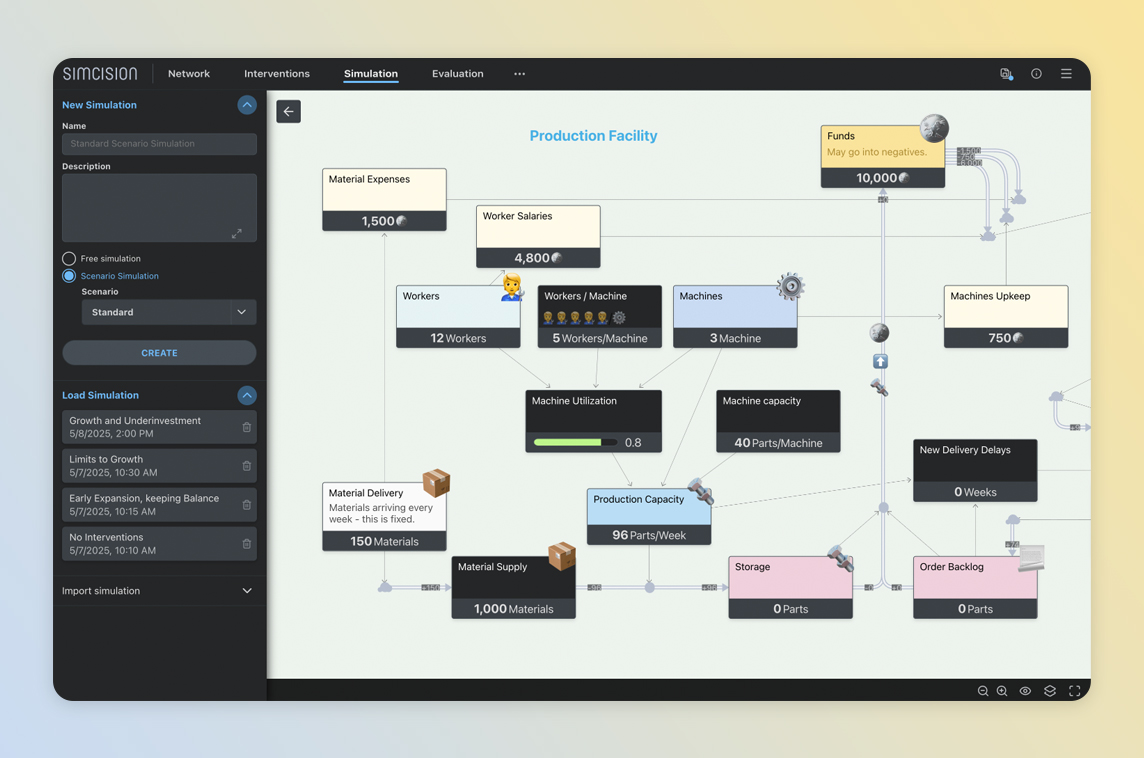
simcision
Tool for Simulation-based Decision Making
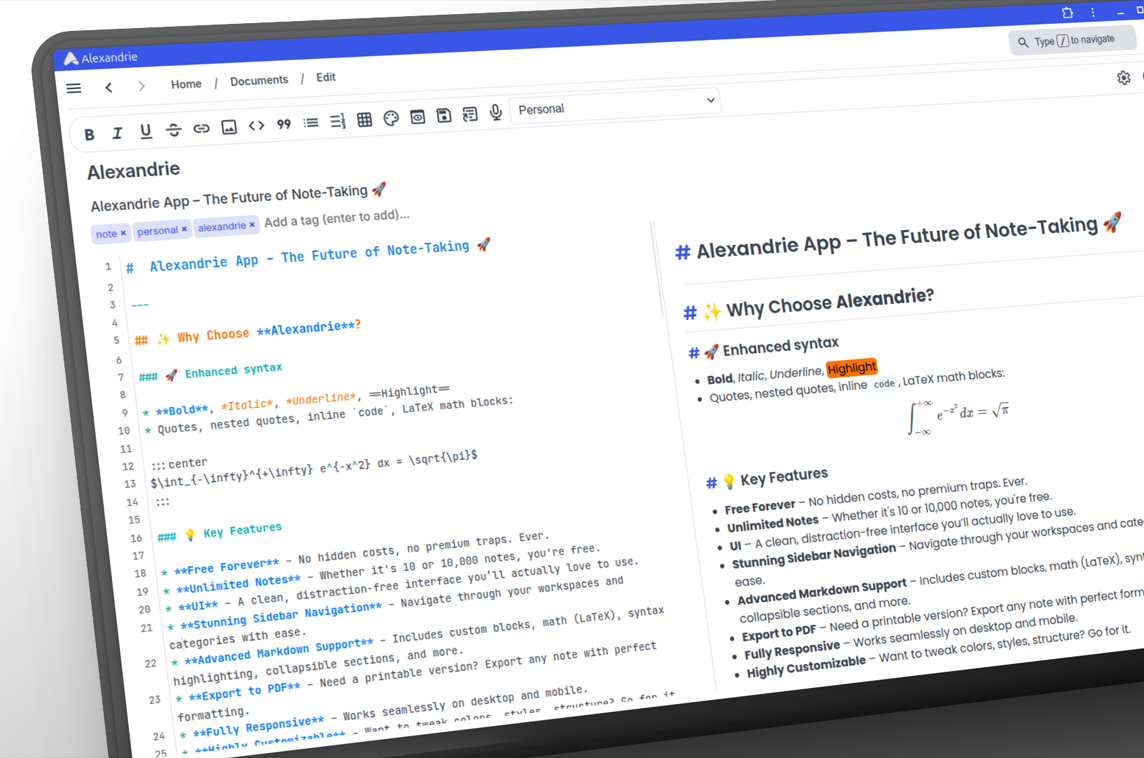
Alexandrie
Open-source Markdown Note-Taking App
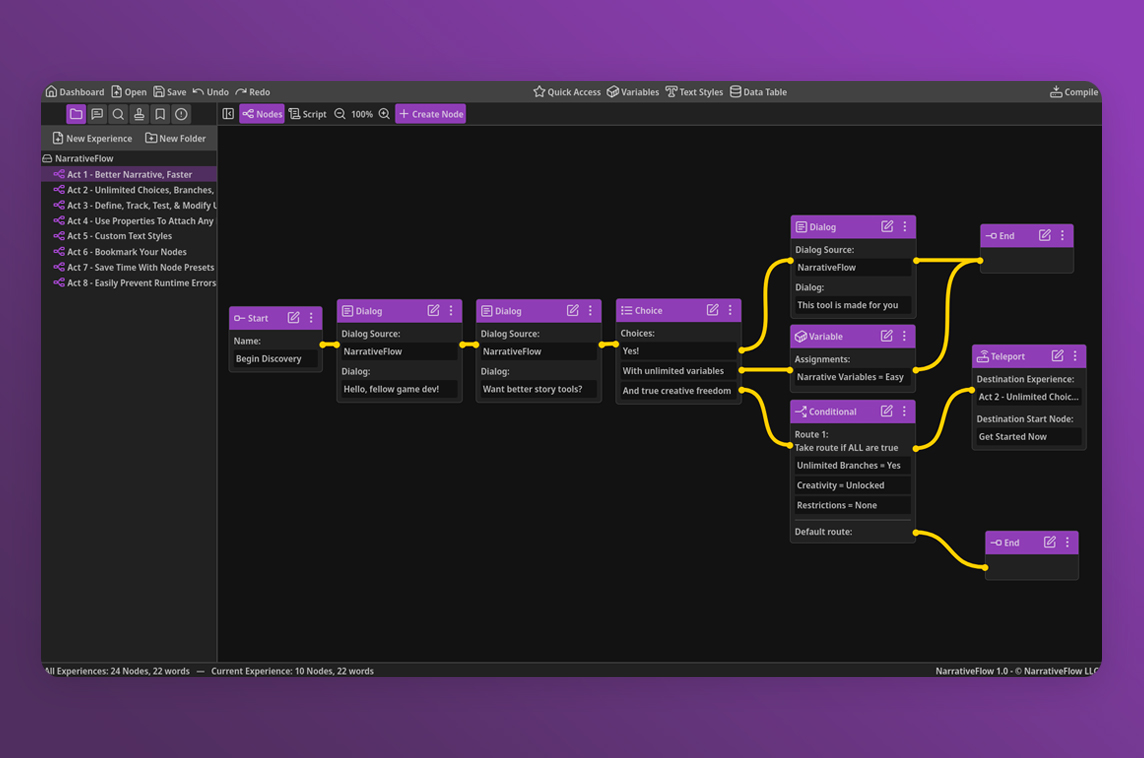
NarrativeFlow
Visual Narrative Design Tool for Game Developers
Deadlines
Minimalist Deadline Tracker
ScreenAsk
Screen Recording Links for Customer Support