
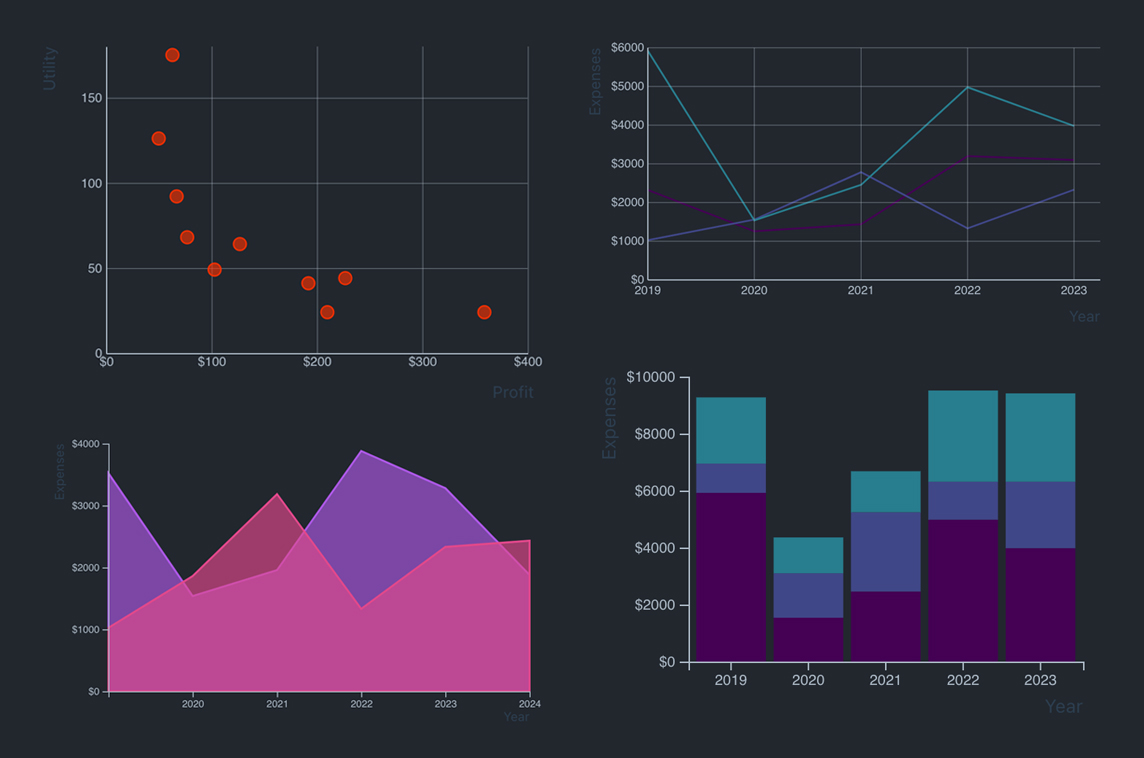
Vuesalize
Component Library for Interactive Visualizations

Description
Component Library for Interactive Visualizations
Overview
Creating interactive visualizations on the web can be challenging, especially when integrating existing visualization libraries into a Vue.js project. Vuesalize addresses this by offering a collection of commonly used chart components and related utilities that streamline the development process.
Architecture
The charts are constructed using a blend of Vue.js and D3.js. This design choice embraces Vue’s paradigm by defining SVG elements directly within the template (HTML). Consequently, Vue manages the creation and removal of elements, mirroring D3’s “enter/update/exit” pattern while leveraging the virtual DOM for efficient updates.
Features
Because the SVG is embedded in Vue’s template, you can:
- Pass props to dynamically update chart data.
- Emit events on user interactions such as clicks or mouseovers.
- Utilize scoped slots to provide custom tooltips and other interactive content.
Creator
Harout Boujakjian
Related Projects
Markstream
AI-powered Streaming Markdown Renderer
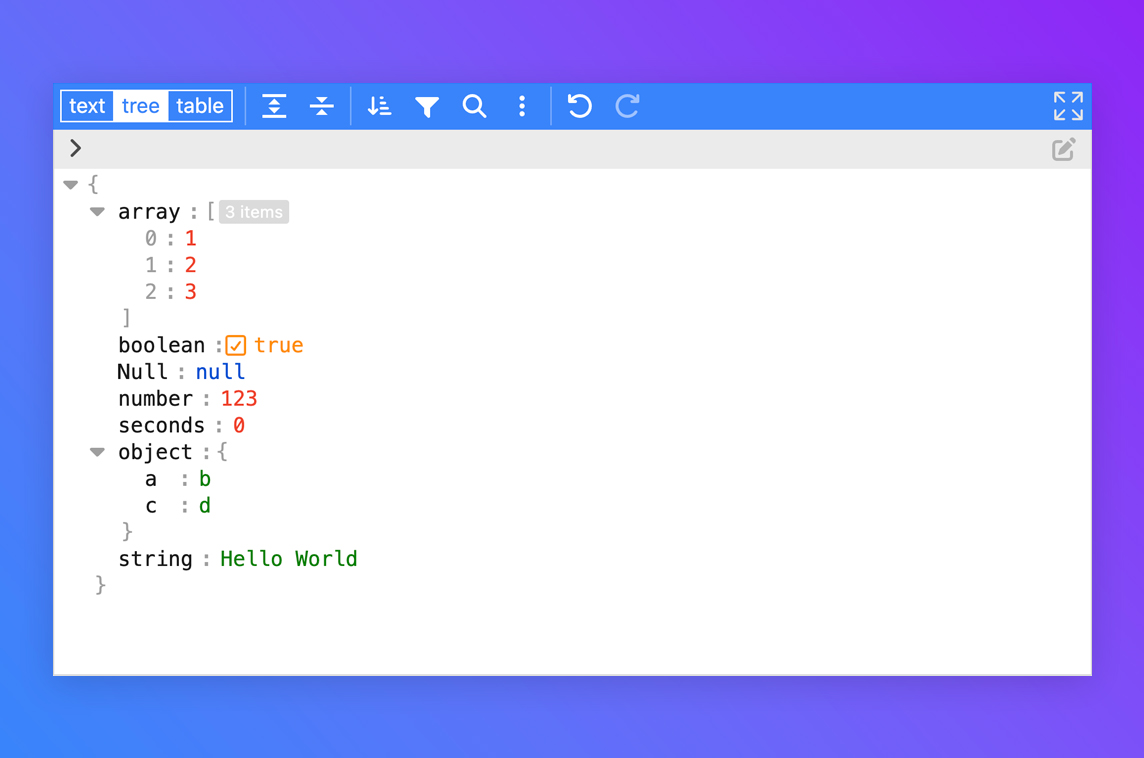
Vue 3 JSON Editor
JSON Editor Component
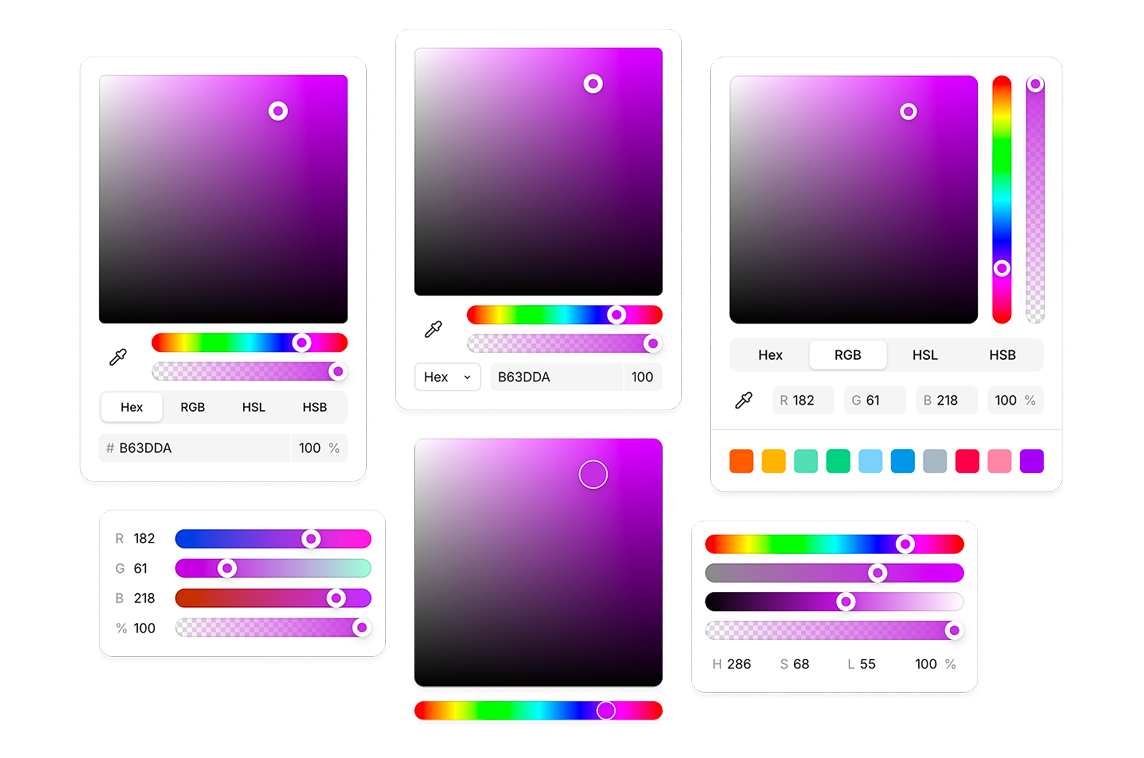
Vuelor
Colorpicker Component

Roughness
Hand-drawn Component Library

Stk Table Vue
Virtual List Component

Phosphor Icons Vue
Icon Set